How to View Soil Samples
Soil Sample Grapher
The following section describes how to:
NOTE: Soil Tests can also be viewed in RX Builder, Field Summary, and Batch Print.
View Soil Tests
1. Click Open Soil Sample Grapher.
2. Select a field from the profile selector on the left. Fields with a current crop year soil test will have a SA icon next to the field ID.
3. After a field is selected, a list of the Soil Test Years will be displayed. Click on a year. Nutrients that were tested for will now be highlighted in blue. Hover your mouse over a nutrient to see an Agvise definition of the nutrient.
4. Click on a nutrient to view the test. Soil tests are displayed differently for zone or grid fields.
5. Zone fields display a bar graph of the selected nutrient. Every zone that was tested and its value are shown. The field average and range are displayed in the top right corner.
6. Grid fields display an interpolated map of the selected nutrient.
Hovering your mouse over the map will display the nutrient value at the pointer location.
To view the results of a specific grid point, click on a point and scroll down below the boxes on the right side of the screen to view the data.
The color table can be customized by clicking Edit, entering values into the boxes, and clicking Done. Values entered here will only apply to the current field. To set default values for every field, contact FieldReveal Mapping Center.
Click Show Histogram to view a histogram of nutrient values on the field. Move the slider to view areas of the field represented by the value at the slider location.
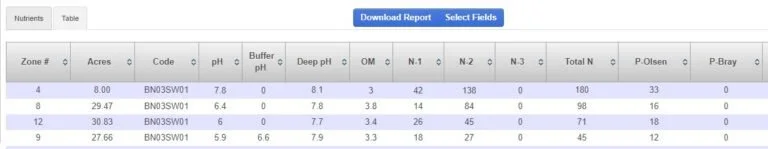
Sample results can also be viewed in a table by clicking the Table tab below the map/bar graph. Grid and zone soil tests can be viewed this way.
Compare Year-to-Year Soil Tests
Multiple years of soil test data, for a single field, can be viewed side by side.
1. Select a field in the profile selector.
2. Select more than one Soil Test Year.
Select a nutrient.
Examples of a zone and grid field are pictured below.