
Soil Samples Tab
Soil Samples
The Soil Samples tab allows a user to view the soil sample results for the field they are working on.
The following section describes how to:
View Sample Results on a Zoned Field
View Sample Results on a Grid Field
Modify Settings
Download a PDF
View Sample Results on a Zoned Field
Use the slider on the bottom of the results to scroll left and right to view the entire test. The Zone and Acres columns will remain stationary.

NOTE: This report can also be downloaded from the Soil Sample Grapher and Batch Print.
View Sample Results on a Grid Field
Use the sliders on the bottom and right of the results to view the entire test. The Sample # column will remain stationary.

Settings
Each color on the soil samples tab correlates to each nutrient’s relative value. These definitions have been determined by Agvise Laboratories.

To edit the nutrients and colors you see on this table, click the blue Settings button in the upper right corner of the form.

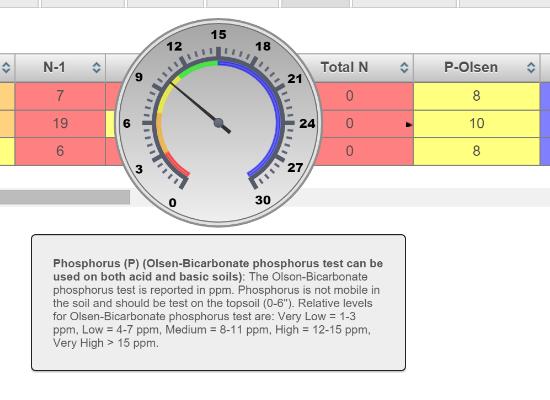
Hovering the mouse pointer over a specific result on the table will display a gauge showing more information on the level of the test, as well as a full definition from Agvise Laboratories.
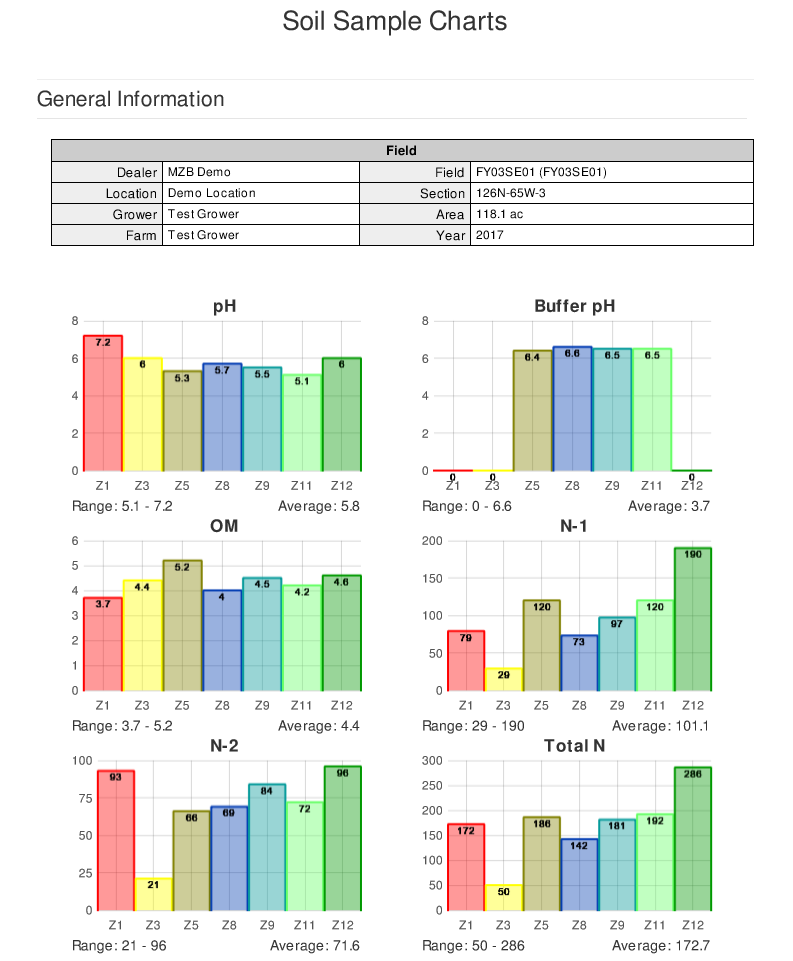
Download a PDF
To Download a PDF of the soil test, click the blue Download PDF button.
